Basic Power Query Tutorials for Data Analytics
Power Query is a powerful tool in Excel and Power BI that enables users to connect, transform, and analyze data from various sources. Here’s a comprehensive guide to help you master advanced features of Power Query for data analytics.
1. Getting Started with Power Query
Overview:
Power Query allows users to perform data transformation and preparation tasks before analysis. It’s integrated within Excel and Power BI.
Accessing Power Query:
- In Excel, go to the "Data" tab and select "Get Data".
- In Power BI, go to "Home" > "Transform Data".
Basic Query Steps:
- Each query has steps recorded in the "Applied Steps" pane, which you can modify or delete.
2. Connecting to Different Data Sources
Importing from Excel, CSV, and Text Files:
- Use "Get Data" to choose your file type and import data directly.
Connecting to Databases:
- Select "Get Data" > "Database", then choose your database type (e.g., SQL Server).
- Enter your credentials and select the tables you want to import.
Web Scraping with Power Query:
- Use "Get Data" > "From Web" to scrape data from web pages. Enter the URL, and Power Query will allow you to select tables from the webpage.
3. Data Transformation Techniques
Cleaning Data:
- Remove duplicates by selecting the column and using "Remove Duplicates".
- Filter rows using the drop-down menus in column headers.
Merging Queries:
- Use the "Merge Queries" option to perform different types of joins (inner, outer, etc.) based on a common column.
Pivoting and Unpivoting Data:
- Pivot: Select the columns to pivot and use "Transform" > "Pivot Column".
- Unpivot: Select the columns to unpivot and use "Transform" > "Unpivot Columns".
4. Advanced Data Manipulation
Creating Custom Columns:
- Use the "Add Column" tab, then select "Custom Column" to create new calculations based on existing data.
Using Conditional Logic:
- In custom columns, use the `if...then...else` structure for logical operations.
Leveraging Group By for Aggregation:
- Select "Group By" in the Home tab to aggregate data (e.g., sum sales by region).
5. Using Parameters and Functions
Creating and Using Parameters:
- Parameters can be created from the "Manage Parameters" option, allowing dynamic inputs in queries.
Custom Functions in Power Query:
- Use "Advanced Editor" to create reusable functions for repetitive tasks.
6. Performance Optimization Techniques
Query Folding:
- Ensure that transformations can be pushed back to the data source to improve performance.
Reducing Load Time:
- Minimize the number of steps in your queries and remove unnecessary columns early.
7. Error Handling and Troubleshooting
Common Errors and Solutions:
- Errors often appear when data types mismatch. Use "Transform" > "Data Type" to correct this.
Debugging Your Queries:
- Step through your query steps in the "Applied Steps" pane to identify where errors occur.
8. Automating Tasks with Power Query
Scheduling Refreshes in Power BI:
- In Power BI Service, set up refresh schedules under the dataset settings.
Using Power Automate for Data Workflows:
- Integrate Power Query with Power Automate for automatic data refreshes and alerts.
9. Practical Use Cases
Case Study: Sales Data Analysis
- Import sales data, clean it, analyze trends, and visualize results in Power BI.
Case Study: Customer Segmentation
- Use Power Query to segment customers based on purchase behavior for targeted marketing.
Getting Started with Power Query.
Overview of Power Query
- Overview
- Accessing Power Query
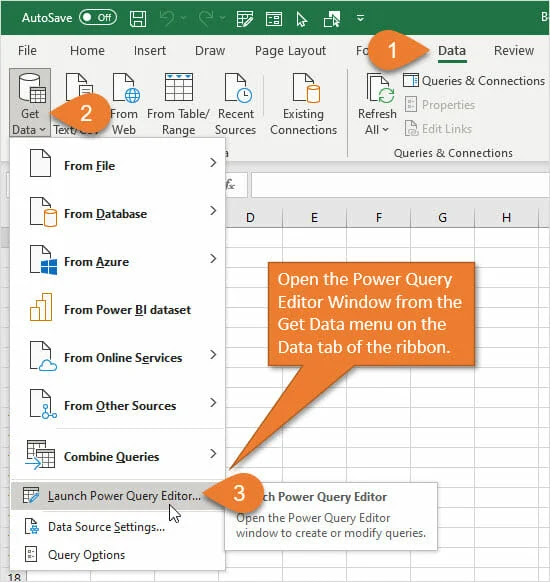
To access Power Query in Excel, you can:
- Select Data > Get Data > Launch Power Query Editor
- Press ALT-F12 on your keyboard

1. Basic Query Steps
2 . Connecting to Different Data Sources
- Importing from Excel, CSV, and Text files
- Access the Power Query feature: Go to the "Data" tab in Excel.
- Select "Get Data": Click on "Get Data" within the "Get & Transform Data" group.
- Choose "From Text/CSV": Select "From File" then "From Text/CSV" to specify that you want to import a CSV file.
- Browse for your CSV file: Locate and select the CSV file you want to import.
- Open the file: Click "Open" to initiate the import process.
- Connecting to databases (SQL Server, Access, etc.)

- Web scraping with Power Query

Key steps:
- Access Power Query: Go to the "Data" tab in your Excel or Power BI application and select "Get Data".
- Choose Web connector: Select "From Web" from the list of data sources.
- Enter URL: Paste the website URL into the designated field.
- Navigate the page: The "Navigator" window will appear, allowing you to select the specific table or data you want to extract from the webpage.
- Transform data: Click "Transform Data" to open the Power Query Editor and further refine the extracted data
3. Data Transformation Techniques
- Cleaning Data: Removing duplicates, filtering rows, and replacing values
Key steps for cleaning data in Power Query:


- Filtering Rows
- Click on the column header of the column you want to filter.
- Use the filter dropdown menu to select specific values or conditions.
- You can use options like "Equals", "Does not equal", "Greater than", "Less than", etc.


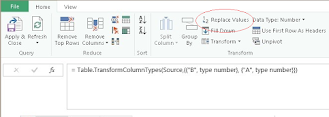
Replacing Values:
- Select the column where you want to replace values.
- Go to "Transform" > "Replace Values".
- Enter the value you want to replace and the new value to replace it with.

Advanced Cleaning Techniques:
- Use the "Advanced Filter" option to filter based on multiple conditions across different columns.
- Group data by specific columns and calculate summary statistics like averages or counts to analyze data further.
- Create new columns using formulas to transform data based on existing values.
To add a custom column in Power Query, you can:


Important Considerations:
- Before cleaning, clearly identify which columns should be used to determine duplicates.
- Check for inconsistencies or outliers in your data before applying cleaning operations.
- Think about the order of cleaning steps to ensure the most accurate results.
Merging Queries: Joins and appends
- Open a query in the Power Query Editor
- Select Home > Merge Queries
- Choose the primary table from the first drop-down list
- Select a join column in the primary table by clicking the column header
- Choose the related table from the next drop-down list
- Select a matching column in the related table by clicking the column header
- Select the type of join from the Join Kind drop-down list
- Select OK


Here are some things to note:
- The default join operation is an inner join.
- You can perform a fuzzy match by selecting Use fuzzy matching to perform the merge.
- You can include only matching rows by selecting Only include matching rows.
- The Merge queries as new option creates a new table with the merge.
- The interface for merging queries is similar in Power BI and Excel.
Pivoting and Unpivoting Data
In Power Query, "pivoting" means transforming data from a long format to a wide format by taking unique values from one column and creating new columns for each unique value, while "unpivoting" is the opposite operation, converting multiple columns into rows, effectively transforming wide format data back to a long format.

4. Advanced Data Manipulation
- Creating Custom Columns
- Using Conditional Logic
- Leveraging Group By for Aggregation
5. Using Parameters and Functions
- Creating and using parameters
- Custom functions in Power Query
6. Performance Optimization Techniques
- Query folding
- Reducing load time with efficient steps
7. Error Handling and Troubleshooting
- Common errors and solutions
- Debugging your queries
8. Automating Tasks with Power Query
- Scheduling refreshes in Power BI
- Using Power Automate for data workflows
9. Practical Use Cases
- Case study: Sales data analysis
- Case study: Customer segmentation
Conclusion
Mastering Power Query can significantly enhance your data analytics capabilities. By using these advanced techniques, you can transform raw data into actionable insights efficiently. Happy querying!
No comments:
Post a Comment